Our Methodology
Transparency in how we predict neural responses
What We Do — And What We Don't
Buyology Labs does not simulate brain scans. We do not have access to your audience's brain activity. What we do is predict neural response patterns using machine learning models trained on published neuroscience research data, combined with AI interpretation of your creative assets.
Our predictions are informed by the same research that guides physical neuroscience labs — we make those findings accessible without requiring R4M+ in lab equipment and 6-8 weeks of study time.
Think of it like a weather forecast: meteorologists don't create weather — they predict it using models trained on historical data. We predict neural engagement using models trained on published experimental data.
Neural Mechanism Transparency
Each virtual device maps to specific neural systems so teams can interpret model outputs in biologically plausible terms.
Virtual fMRI
Reward circuits (accumbens, vmPFC, OFC)
Eye Tracking
Visual cortex (V1-V4), FFA, PPA, EBA
GSR / ECG
Autonomic arousal (amygdala, insula, ACC)
Virtual EEG
Attention networks (prefrontal, parietal)
Virtual fNIRS
Cognitive load (DLPFC, anterior PFC)
Facial Coding
Emotion circuits (amygdala, insula, STS)
Buyology's virtual devices predict likely neural activation patterns based on AI models trained on published neuroscience datasets. These are neuroscience-informed predictions, not clinical measurements.
Our Data Sources
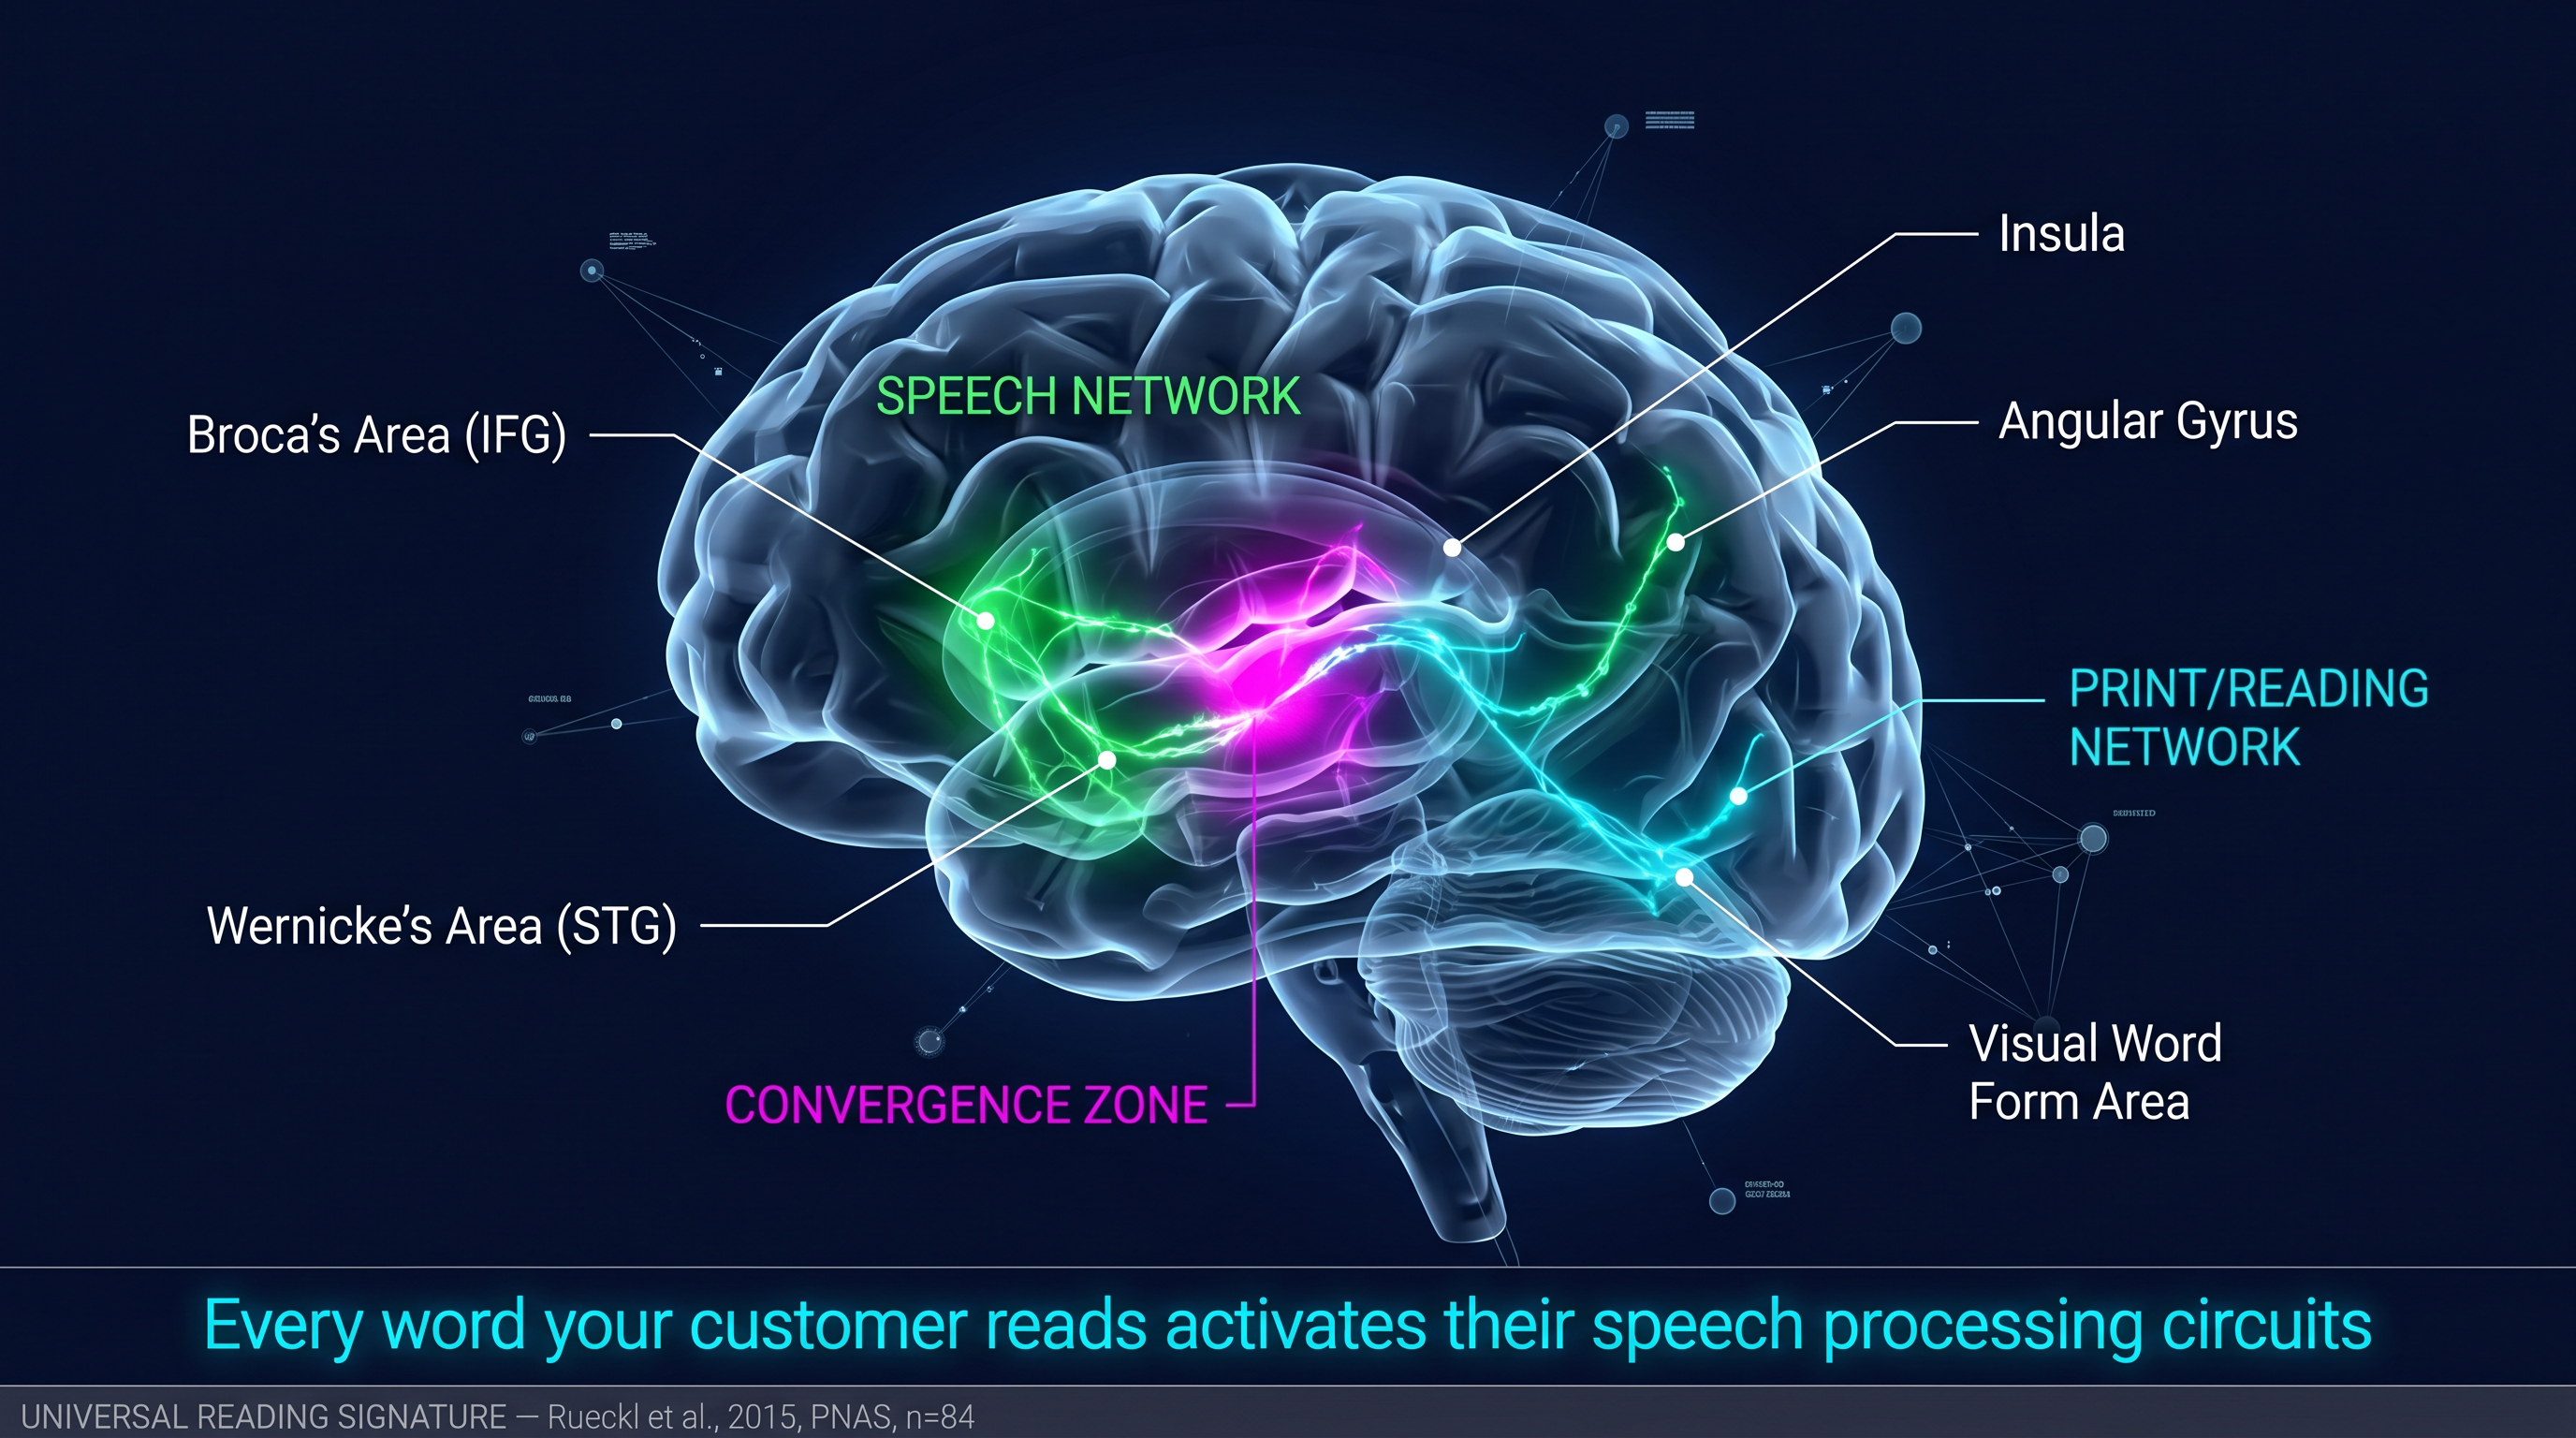
Our analysis prompts are grounded in 30+ published studies from journals including Neuron, Journal of Marketing Research, Psychological Science, and Journal of Consumer Psychology. Key researchers include Pieters & Wedel (eye-tracking), Knutson et al. (fMRI purchase prediction), Cahill & McGaugh (emotional memory), and Reber et al. (processing fluency). Our language processing analysis draws on Rueckl et al.'s 2015 PNAS study (n=84, 4 languages) demonstrating that reading universally activates speech processing circuits. When South African consumers encounter text in their second language, the additional Broca's area activation for translation competes with the prefrontal circuits needed for purchase decisions — explaining the measured neural cost differential across SA's 11 official languages.
1,280 EEG and GSR recordings from 32 participants during emotional stimulus viewing (Koelstra et al., 2012). Used to inform our emotional engagement and arousal models.
Real galvanic skin response recordings measuring cognitive workload under controlled conditions. Our GSR model achieves AUC 0.70 in distinguishing high vs low mental workload states.
42 participants with simultaneous EEG and eye-tracking recordings during supermarket brochure viewing with purchase decisions (Georgiadis et al., 2023, Nature Scientific Data). Used for purchase intent model calibration.
Attention heatmaps generated using a 6-channel saliency computation based on Itti & Koch (1998) visual attention theory: color contrast, edge density, color warmth, intensity contrast, center bias, and text region detection.
Every completed analysis feeds anonymized cohort benchmarks (124+ analyses and growing). Industry quartile comparisons are computed from this proprietary dataset alongside published research baselines.
Our ML Pipeline
Every analysis runs through a three-stage pipeline:
Stage 1: AI Vision Analysis
Claude Sonnet 4.6 examines your creative asset and identifies visual elements, emotional triggers, cognitive complexity, and demographic relevance. The AI is prompted with research context from our database of 30+ neuroscience papers relevant to the asset type.
Stage 2: ML Model Calibration
Six ONNX machine learning models independently score the creative based on extracted features. Five models predict attention, emotion, memory, purchase intent, and cognitive load using feature weights derived from published research. A sixth model trained on real GSR physiological data predicts cognitive workload. These scores are blended with the AI analysis at a 30/70 ratio (30% ML, 70% AI).
NeuMa — our purchase-intent calibration model trained on the NeuMa neuromarketing dataset (Georgiadis et al., 2023, Nature Scientific Data) — predicts purchase intent from EEG brain activity patterns recorded during real supermarket brochure viewing. NeuMa achieves AUC 0.746 in distinguishing Buy from NoBuy decisions, validated on 405 labeled brain recordings from 42 participants.
Packaging-specific analysis evaluates shelf differentiation, purchase trigger speed, color psychology, typography readability at shelf distance, material perception, and redesign risk — grounded in packaging research from Clement (2007), Orth & Malkewitz (2008), and Silayoi & Speece (2007).
Stage 3: Behavioral Science Audit
Our AI Creative Director — informed by 54 behavioral science principles with citations from Kahneman, Cialdini, Ariely, Sutherland, and related foundational work — critiques the creative, identifies principle violations, and provides specific fixes with expected impact percentages grounded in published research.
ML Calibration Delta
Every analysis produces two parallel signals: a surface score from Claude Sonnet 4.6 (composition, messaging, hierarchy, brand cues) and an ML neural prediction from six ONNX models calibrated on published neuroscience data.
The ML Calibration Delta is the gap between these signals — where AI interpretation and neural models agree or diverge. Large deltas flag creative that reads well on paper but may underperform neurologically (or vice versa), guiding which fixes to prioritize before launch.
NeuMa (AUC 0.746) anchors purchase-intent calibration; GSR and synthetic GBR models cover workload, attention, emotion, memory, and cognitive load. The delta is surfaced in reports so teams can reconcile creative judgment with calibrated neural evidence.
Campaign Intelligence methodology
Campaign Intelligence scores 2–20 assets in parallel, then synthesizes cross-asset patterns on Claude Sonnet 4.6.
- Per-asset scoring — each file runs the full pipeline (6 ONNX models, 54-principle audit, geographic conditioning).
- Cross-asset synthesis — ranked variants, consistency analysis (visual, tonal, message alignment), and a kill list of underperformers to cut before media spend.
- Deferred Advisor — batch runs stay fast; full advisor depth generates on demand when you open an individual asset report.
- Deliverables — interactive campaign dashboard plus 11-section print-ready PDF exports for client presentations.
Model accuracy (validation)
Validation metrics are benchmarked against published neuroscience datasets to maintain research-grade directional reliability.
NeuMa EEG validation
AUC 0.746
Purchase vs no-purchase prediction on a 42-subject NeuMa EEG dataset (405 labeled segments from real brochure viewing).
GBR synthetic models
R² 0.76–0.85
Gradient-boosted regressors on research-grounded synthetic training sets for attention, emotion, memory, and visual cognitive load.
GSR workload model
AUC 0.70
Binary classification of high vs low mental workload from real galvanic skin response recordings.
Behavioral science audit
54 principles
Structured creative critique grounded in 54 behavioral science principles, each tied to citations from foundational research.
Best used for
- Comparative testing (A vs B) — rank-order creatives and quantify directional lift.
- Pre-launch creative validation — stress-test layouts, packaging, and key visuals before media spend.
- Identifying attention and cognitive friction — where eyes likely go and where processing feels heavy.
- Prioritizing design fixes by neural impact — focus iteration on changes with the largest modeled effect.
Not designed for
Clear boundaries build trust. Buyology Labs is not the right tool for:
Clinical diagnosis
We do not assess mental health, neurological conditions, or medical states. This is marketing intelligence, not clinical neuroscience.
Individual consumer prediction
Scores reflect population-level tendencies from published data — not whether a specific person will click, buy, or prefer an option.
Replacing qualitative research entirely
Virtual neuromarketing complements depth interviews, ethnography, and brand judgment; it does not substitute human context where stakes are high.
Limitations — What We're Honest About
No predictive model is perfect. Here's what you should know:
- Our predictions are directional, not absolute. A NeuroScore of 65 vs 72 indicates meaningful difference. A difference of 1-2 points may not be.
- Demographic calibration is inference-based, not empirically measured per segment. We don't have separate neural recordings for each LSM tier or province.
- Our attention heatmaps use computational saliency models, not actual eye-tracking hardware. They predict where attention is likely to land based on visual properties.
- Individual variation is real. Our models predict population-level tendencies, not how any single person will respond.
- We continuously improve. As we collect validation data from customer outcomes, our models get more accurate.
Validation Roadmap
We are actively working on:
- Hardware validation studies comparing our predictions against Emotiv EEG and Tobii eye-tracking data
- Published correlation analysis using the NeuMa neuromarketing dataset
- Customer outcome tracking to measure prediction-to-performance accuracy
- Expansion to additional neuroscience datasets for model training
Dataset transparency
We train and validate against published datasets and open literature. Below are the primary sources and where to read the original papers.
NeuMa neuromarketing dataset
Simultaneous EEG and eye-tracking during supermarket brochure viewing with purchase decisions (Georgiadis et al., 2023).
DEAP
Database for emotion analysis using EEG and peripheral physiological signals (Koelstra et al., 2012).
GSR cognitive workload (training)
Real GSR recordings used to train our high vs low mental workload classifier. Metrics and protocol are summarized on our validation page.
Research-grounded synthetic training
Synthetic feature sets for attention, emotion, memory, and load models, weighted from published eye-tracking and cognitive science literature.
Research Citations
- Pieters, R., & Wedel, M. (2004). Attention capture and transfer in advertising. Journal of Marketing.
- Knutson, B., et al. (2007). Neural predictors of purchases. Neuron.
- Cahill, L., & McGaugh, J.L. (1998). Mechanisms of emotional arousal and lasting declarative memory. TINS.
- Reber, R., Schwarz, N., & Winkielman, P. (2004). Processing fluency and aesthetic pleasure. Personality and Social Psychology Review.
- Itti, L., & Koch, C. (1998). A model of saliency-based visual attention. IEEE PAMI.
- Kahneman, D. (2003). A perspective on judgment and choice. American Psychologist.
- Cialdini, R.B. (2001). Influence: Science and Practice.
- Georgiadis, K., et al. (2023). NeuMa neuromarketing dataset. Nature Scientific Data.
- Koelstra, S., et al. (2012). DEAP: A database for emotion analysis using physiological signals. IEEE TAC.
- Wang, H.E., et al. (2024). Virtual brain twins. National Science Review.
- Rueckl, J.G., et al. (2015). Universal brain signature of proficient reading. PNAS 112:15510-15515.